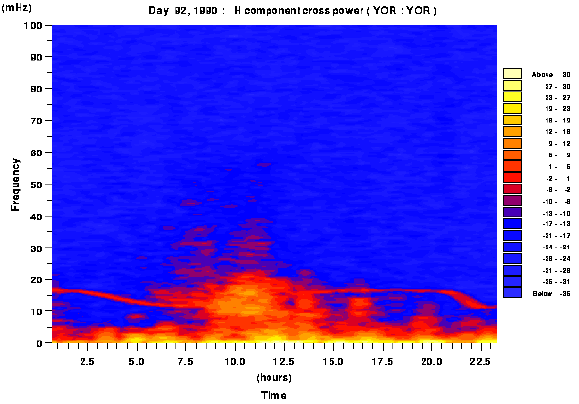
This first graph is included for it's prettiness. It's a power spectrum showing the strength of the magnetic field at a variety of frequencies (in mHz) on 2/4/90 in York (behind Wentworth college). The wiggly feature which lasts all day between 10 mHz and approx 20mHz is equipment noise discovered by me (but they haven't named it after me yet).

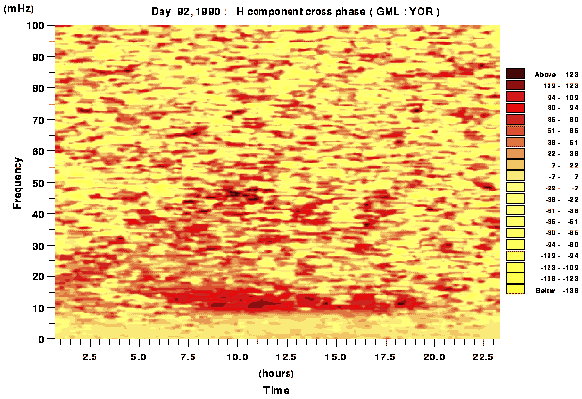
The second graph shows the very heart of my project, an actual field-line resonance. The f.l.r. is the red blotch at around 15mHz lasting from (approx) 6am to 19pm - or so I believe.

 Back to my
home page.